To understand how the pricing tool works, we recommend walking through specific cases step-by-step within the demo sales list.
Example: Row 7
„The customer Wolf from the USA intends to purchase 5 units of product J. …
The sales team estimates an 80% product-need fit and an 80% probability of closing. Initially, the team planned a discount of 20.18%. The AI tool, however, suggests a discount of 19.02%. Based on this guidance, a final discount of 19.7% is agreed upon. …
The case was sold on 01.08.2025 and the employee in lead was abc, supported by klm. …
The sale was successful („sold„), and by incorporating the AI recommendation, an additional total revenue gain of 1150.20 € (20.18% – 19.7% = 0.48%) was achieved.“
Key points for your analysis:
Exploration: Follow the logic for other „sold“ and „not sold“ cases to see the tool’s consistency.
Transparency: Look at cases where the AI-recommended discount led to a negative income (e.g., rows 71 and 242) to understand the risk-reward balance.
Neutrality: In rows 4 and 14, the AI recommendation had no effect (Income = 0).
Guidance: Pay attention to the AI Note column (e.g., in row 5). This field indicates if specific data is missing to generate a reliable recommendation.
Performance: Explore the automated worksheets for customer, region, and product rankings, as well as team achievements and revenue overviews.
What the pricing tool adds to your sales list
The pricing tool integrates directly with your existing Excel sales list, automatically adding 8 additional columns:
2 types of AI-recommended discounts (%)
1 AI Note column for data quality feedback
5 types of resulting income gain or loss (€)
And 6 worksheets with comprehensive statistics:
3 worksheets tracking the performance of all customers, regions, and products
2 worksheets highlighting team achievements
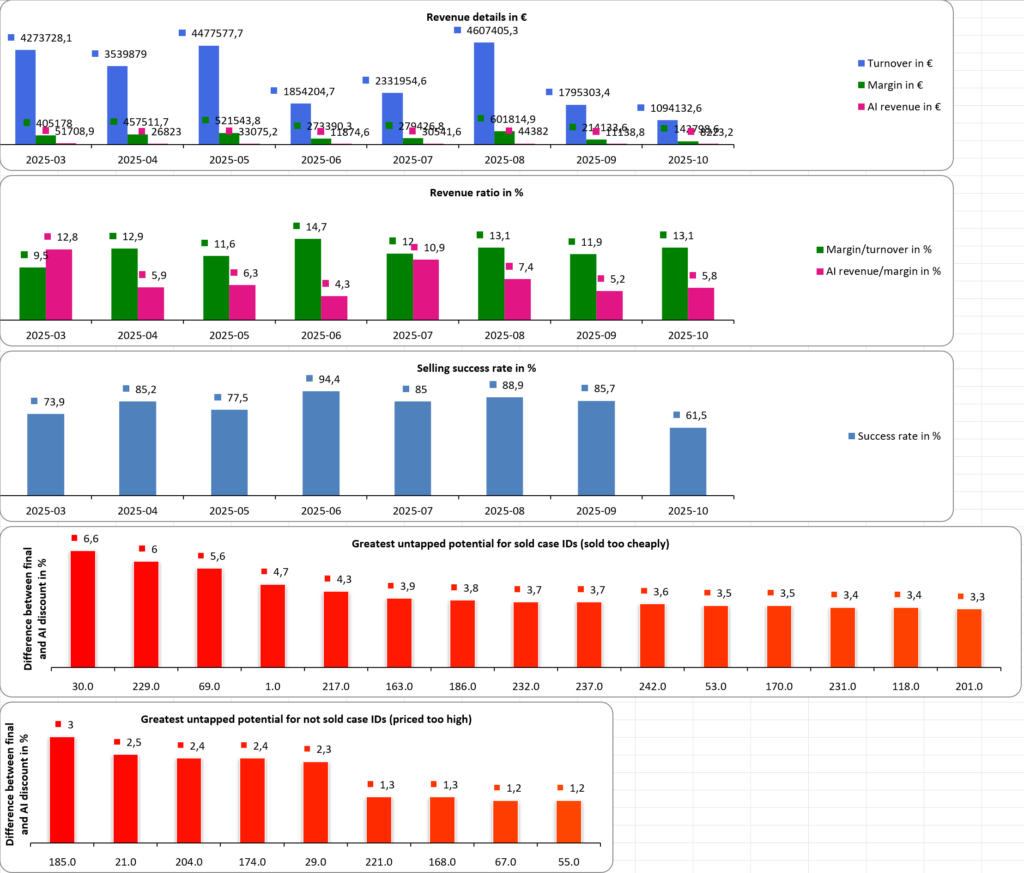
1 worksheet providing a monthly revenue overview (displayed below)
Note: To calculate the recommendation, the tool requires 17 mandatory input fields. This demo also includes 7 optional columns, demonstrating how the tool can be customized to match your internal sales structure.
Standard workflow
Inquiry: The sales team enters case details and discusses an initial discount.
Pricing tool execution: The tool generates the AI discount recommendations for all open cases.
Decision: The final discount is determined by the sales team, who evaluate the AI recommendation alongside the initial discount to make a final decision.
Closing: Once the deal is closed, the final outcome (Sold or Not Sold) is entered into the Excel sales list.
Pricing tool execution: The tool calculates income gains or losses and updates performance statistics for all closed cases.
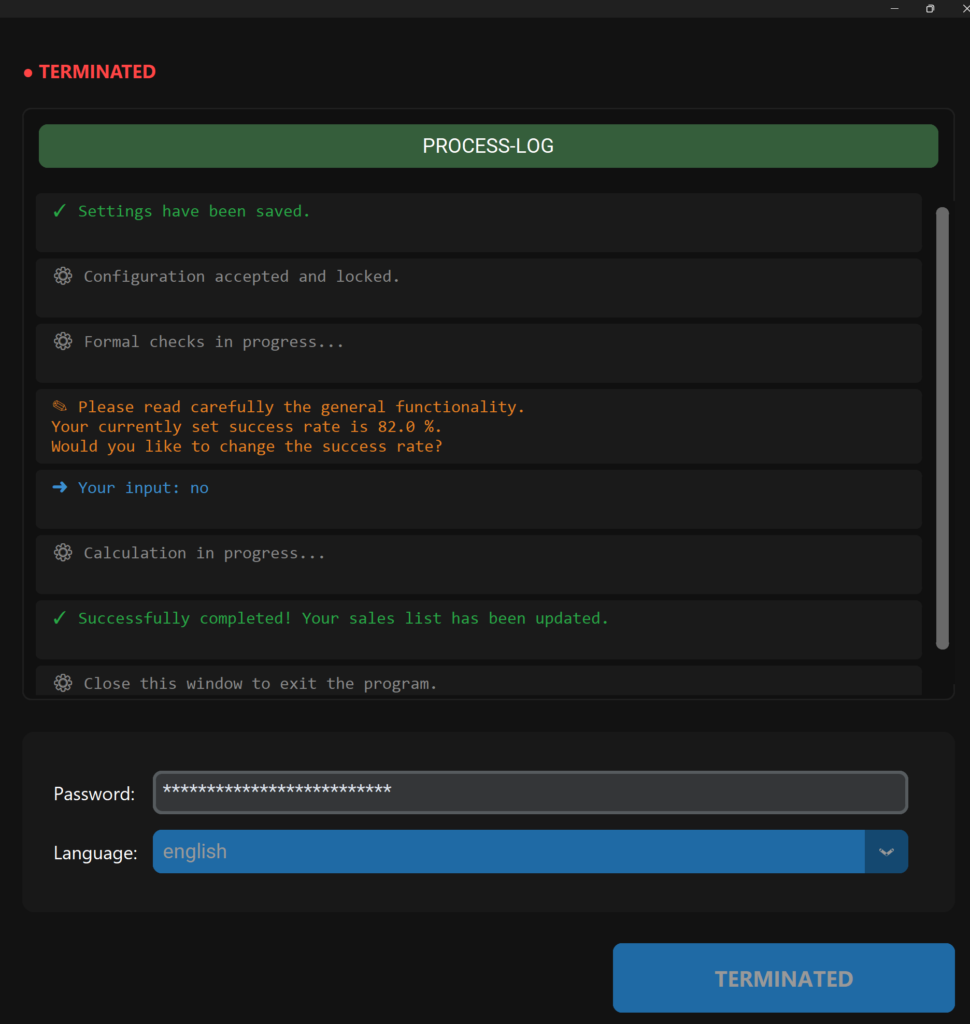
The pricing tool can be executed at any stage of the process, directly from your taskbar. A dashboard (see below) opens, allowing you to set your preferred selling success rate and update your sales list instantly.
The Result: In our underlying case study of a medium-sized industrial company, this method led to a total margin increase of over 2%, a result that aligns with industry benchmarks from McKinsey & Company, who report margin improvements of 2% to 7% through systematic pricing excellence.